Why Infographics Should be Part of Your Content Marketing Strategy in 2015
Marketing experts have dubbed 2015 the year of content marketing. While content marketing has been on the ascendancy for the last three years, its popularity will only continue to grow this year as marketers increasingly focus on creating high-quality content that engages and educates target audiences, increases brand awareness, and nurtures leads.
Content, and the platforms used to distribute it, have diversified greatly over the last three years. Social media sites like Twitter have introduced native video players in a bid to increase user engagement and compete with larger social media sites like Facebook. Last year, Socialbakers revealed that Facebook would surpass YouTube in terms of video uploading and sharing by the end of 2014.
2015 will also see the increasing production of platform agnostic content that can be adapted to different platforms and devices. Moreover, 2015 will see many brands and marketers reducing their production of longform content, as compelling stories, bite-sized content, and arresting visuals (think Vine and Snapchat) gain more prominence.
Report is too Long? Create an Infographic!
With all these exciting developments thrown into the mix, infographics will remain a vital content marketing tool. Also known as information graphics, infographics utilize text and visuals to present complex information quickly and clearly. As attention spans continue to shorten, audiences are on the lookout for content that transmits information as coherently and quickly as possible. (Its an added advantage if they get entertained while doing so!)
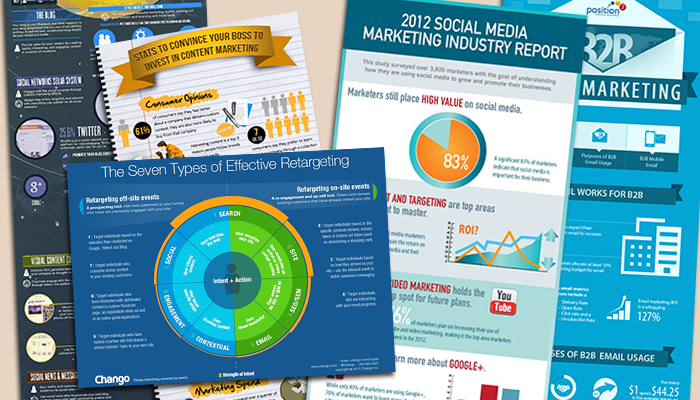
Figure 1 (Sources: Visual.ly/Infobrandz)
Infographics are ideal for such an audience because theyre easier to understand than lengthy whitepapers and reports. Using infographics, marketers can transmit facts, figures, news, and other data quickly and effectively to their target audience. [See Figure 1] Indeed, the creation and dissemination of high-quality, targeted infographics can help marketers cut through all the marketing noise and effectively engage their target audience.
[Infographics] can be a brilliantly effective way of marketing a product, promoting an experience, educating and raising awareness of any subject you can think of. A great design can engage and captivate and inspire people to action, stated the designer Jessica Draws, in an article for Creative Bloq.
In this information age when there is so much information to digest and compete with each other, an image, clever use of typography and a well thought out narrative can tell that story much quicker and more effectively.
As a result of these advantages, the number of infographics commissioned by brands, businesses, and organizations has risen substantially over the last three years.
Tips on How to Create an Effective Infographic
To create an effective infographic that will drive your marketing goals, youll need a topic or series of topics that are connected to your marketing goals. This topic, or series of topics, needs to be backed up by a substantial amount of well-researched and well-edited data.
When it comes to visual design, youll need a workable wireframe, color palettes, as well as brand guidelines to inform the creation of your infographic. Shutterstock recently released an appealing, well-organized, and compelling infographic that also happens to contain a lot of valuable information. The viewer is drawn by the intriguing subject matter; proper use of typography, imagery, and color; and coherent design. [See Figure 2] As Jessica Draws so aptly noted, An infographic needs a [proper] narrative and a flow.
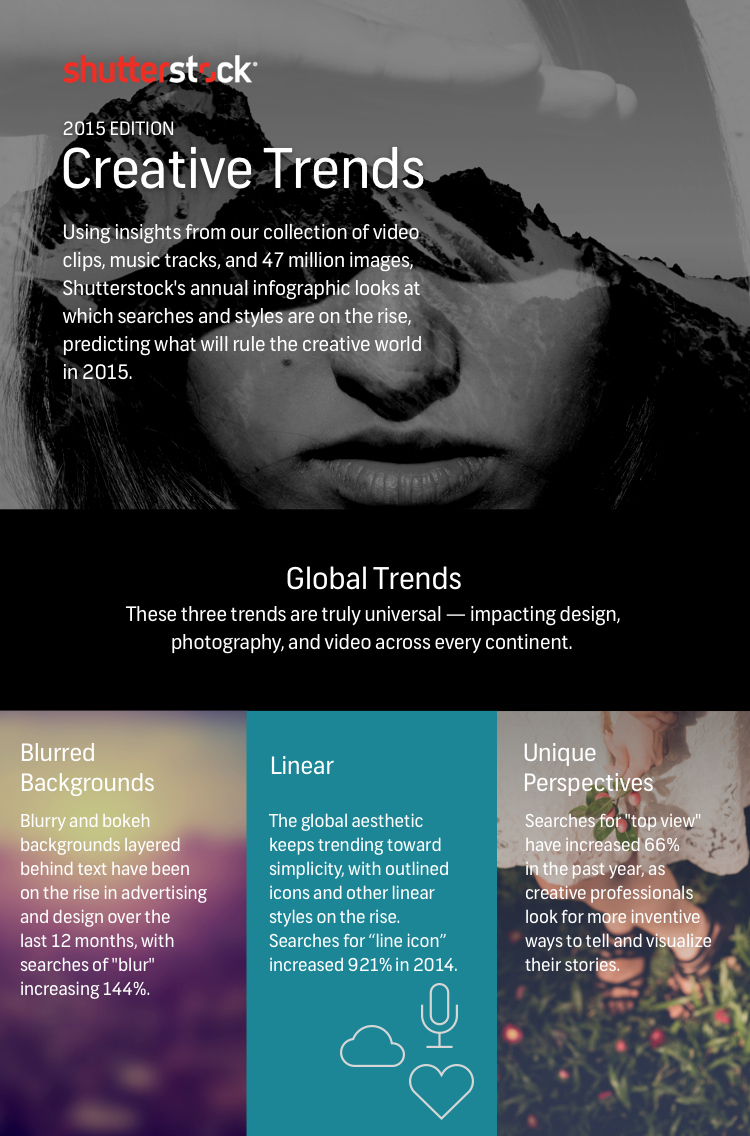
Figure 2 (Source: Shutterstock)
Like any narrative, your infographic will require a logical structureone that has a beginning, middle, and ending. Wireframing the infographic will enable you to flesh out a great storyboard and layout for the design.
Aside from telling a great story and organizing data into logical sections, youll also need to supply your infographic with a hook. A hook is a primary takeaway that leads to an A-ha! moment for the viewer. As the hook is often the focal point of the infographic, it should be placed at either the center or very end of the infographic to ensure that it grabs the viewers attention. Hooks can also be emphasized visually by being rendered bigger or bolder than the surrounding information.
For more tips on how to create an effective infographic, check out Smashing Magazines helpful guide.
Do infographics drive your marketing goals? Are you planning to use infographics in your content marketing strategy this year?
Comments
comments