
Googles Q3 2014 Financial Results: Paid Clicks & Traffic Acquisition Costs Move Up, CPCs Drop
Despite stiff competition from tech rivals, Googles financial performance remains relatively solid. Its the second most valuable brand in the world (behind Apple) and is valued in the billions. Investors must have been very pleased when the most recent financial results were released on October 16, 2014.
Google announced its consolidated revenues for the third quarter of 2014, resulting in a 20% increase in total revenues, or $16.5 billion growth compared to last years figures.
Of Googles total revenues, more than half (68%) accounted for sites revenues at $11.25 billion, which went up by 20% from $9.38 billion last year. Network revenues generated 21% or $3.43 billion, representing a 9% increase from $3.15 billion. Only 11% came from other revenues, but it rose by 50% from $1.23 billion last year, the largest increase in Q3. [See Figure 1]
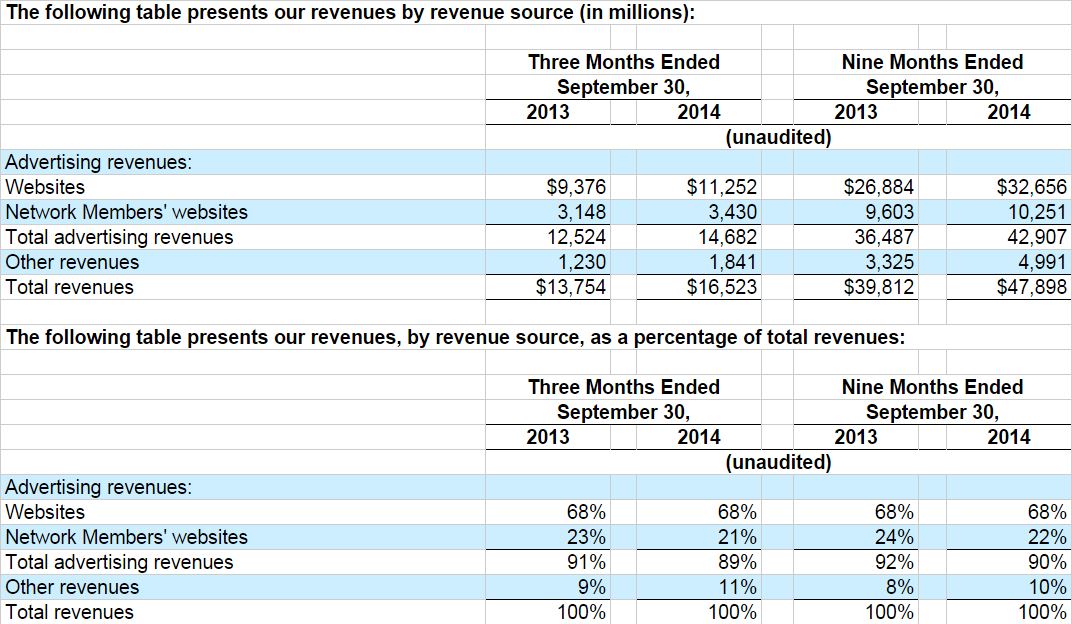
Figure 1 (Source: Google Investor Relations)
Meanwhile, international revenues increased to 58%. Revenues coming from the United Kingdom reached $1.63 billion, representing a constant 10% of total revenues since last year. Additionally, Googles foreign exchange rate during the third quarter of 2014 remained constant compared to Q2 of 2014 and Q3 of 2013. On the other hand, there was a decline in Googles revenue benefit through the companys foreign exchange program. From $22 million last year, it went down to $10 million this quarter.
There was also a slight increase in overall paid clicks. Including clicks related to ads served on Google and Network sites, it grew approximately 2% quarter-over-quarter, while roughly 17% was the recorded increase year-over-year. Google sites generated more paid clicks, with approximately 24% year-over-year increase and approximately 2% quarter-over-quarter increase. Additionally, traffic acquisition costs (TAC), the portion of revenues shared with Google’s partners, went up to $3.53 billion in Q3 of 2014 from $2.97 billion in Q3 of 2013.
On the other hand, network cost-per-clicks went down by roughly 2% year-over-year, but remained constant from Q2 of 2014. Google site CPCs decreased approximately 4% compared to last year and nearly 1% from the previous quarter. Network site CPCs also decreased approximately 4% from last year but grew approximately 2% from Q2 of 2014.
As shown in Figure 2 below, Googles net loss from discontinued operations went down to $185 billion in the third quarter from $193 million in 2013. With the pre-tax adjustment, net loss from discontinued operations is $26 million related to the release of the deferral of certain revenue for the Motorola Mobile segment. According to the report, if Motorola Mobile was presented as an operating segment, its revenue this third quarter would have been $1.69 billion, which could have decreased $26 million from Googles recorded net loss.
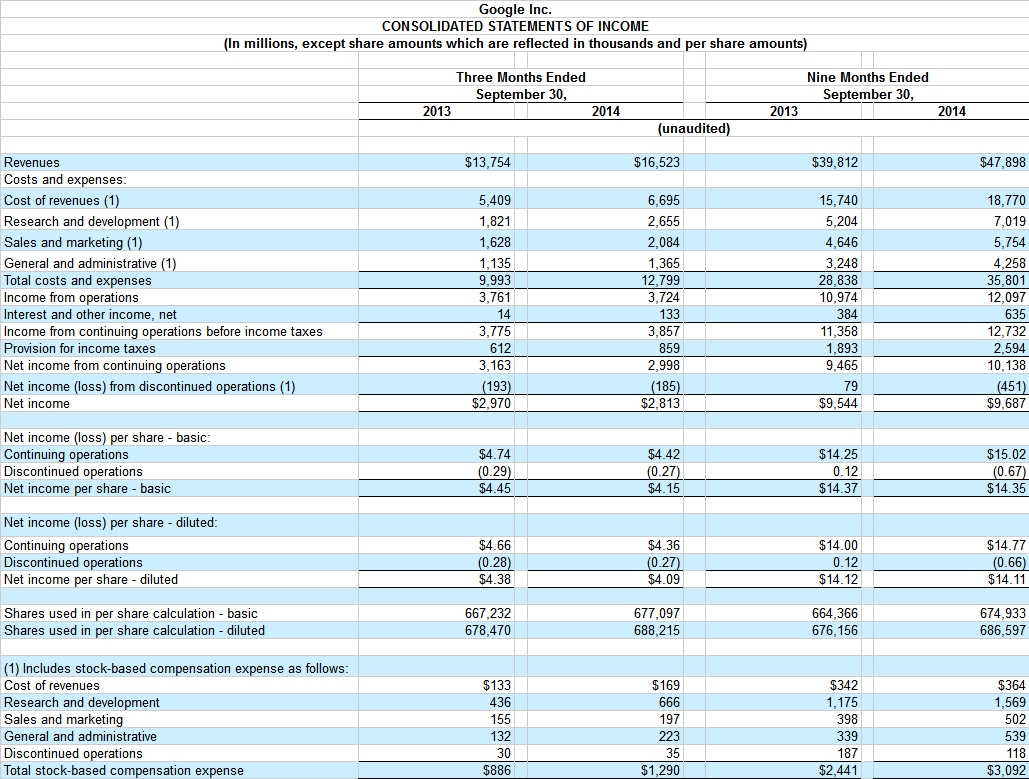
Figure 2 (Source: Google Investor Relations)
Moreover, Googles total number of full-time employees was 55,030 (3,466 are in Motorola Mobile and 51,564 in Google) as of September 30, 2014. There was an increase in Google employees and decrease in Motorola Mobile employees compared to last quarters headcount, with 48,584 employees in Google and 3,485 in Motorola Mobile by June 30, 2014.
What are your thoughts on Google’s Q3 2014 financial results? Do you think the figures reported correspond to actual performance? Let us know your opinion in the Comments section below!
Comments
comments