comScore Study: The Mobile Industry is Being Shaped by the App Majority
Appswe all know what they are and we use them for a variety of reasons. Just a few years ago, all we had were desktop widgets or bundled-in features that came with our cellphones. With smartphone and tablet usage booming, apps have now become the main driver of mobile traffic and are now part of our everyday activities. Desktop still dominates the majority of online traffic, but mobile recently surpassed it in terms of digital media engagement. This milestone, according to comScore, shows that mobile apps are the fuel for growth.
Any good business knows, however, that success takes time and despite mobile’s rapid ascent, it is still an emerging market. As such, it is still developing its infrastructure, and many companies are reluctant to buy ads on a new platform they may not know much about. However, comScore believes that the future is very bright for mobile, and their recent study on app usage in the US shows that there is no better time to jump into the mobile market than now. Among other things, their study took a closer look at peoples daily app habits, how it correlates to what kind of apps are being used, and what the top apps are per demographic.
Part 1: App User Habits
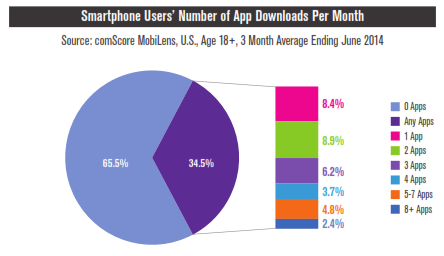
Figure 1
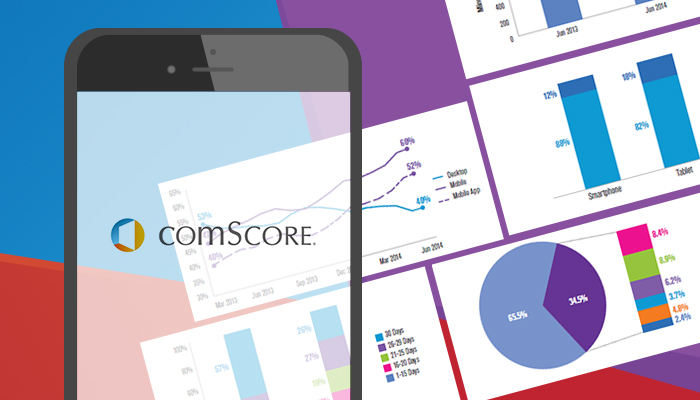
One of the first things to take note of in this growing industry is users behavior when it comes to downloading apps. As seen in Figure 1, more than one third of users will download at least 1 app per month. comScore also postulates that from this percentage, users download at least three apps on average.
However, the study is quick to point out that this was only a small fraction of what was being represented, saying that the total number of app downloads is highly concentrated within a small segment of the smartphone population. Given this, tablet downloads need to also be considered, and it would be interesting to see if users download just as much as they do on their smartphones.
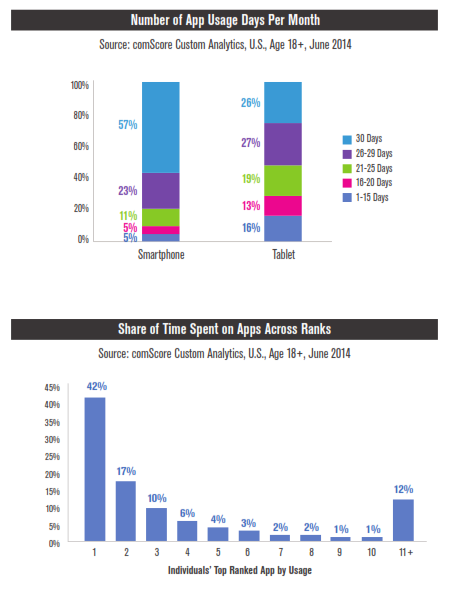
Figure 2
As Figure 2 above shows, however, the time people spend on their devices would give an idea of how many apps they would download. While tablet users seemed evenly divided on how many times they use their apps per month, more than half of smartphone users used theirs at least once a day. It is also telling that they will spend majority of their time on just one app.
With smartphones being more portable than tablets, it would stand to reason that there would be more apps downloaded on it. For instance, consumers would be more likely to have their smartphones while shopping with their corresponding app rather than a bulkier tablet. Regardless, comScore observes that Americans have a difficult time living without their mobile devices.
Part 2: App Category
Figure 3
So what apps do people spend time with most? As Figure 3 shows, social networking apps take up 25% of peoples time. More importantly, four out of the top five apps downloaded would fall under recreation or entertainment. Consider the earlier point made with regard to how much time people spend on their apps. If they are using their devices for entertainment purposes, it would certainly mean that games, radio, and multimedia apps are kept running for most of the day. comScore notes that their heavy usage also far outweighs their desktop counterparts.
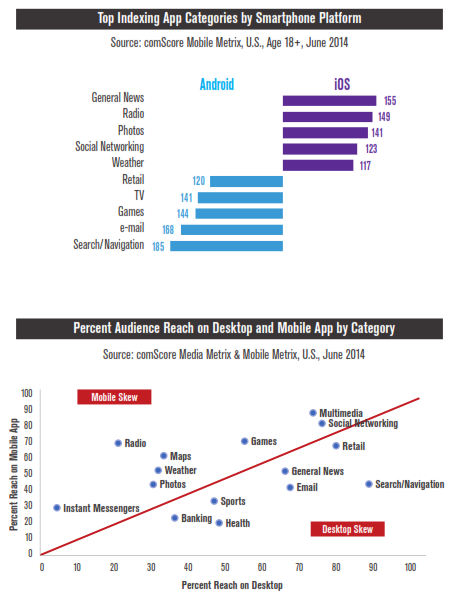
Figure 4
An interesting correlation that comScore took note of was the operating device used. While iOS users were more likely to index media apps higher (along with radio, photo, and general news), Android users spent more time with their email and search apps. comScore deduced that this may have to do with Google products, like Gmail and Google Search, being native to Android by default.
Part 3: Top Apps
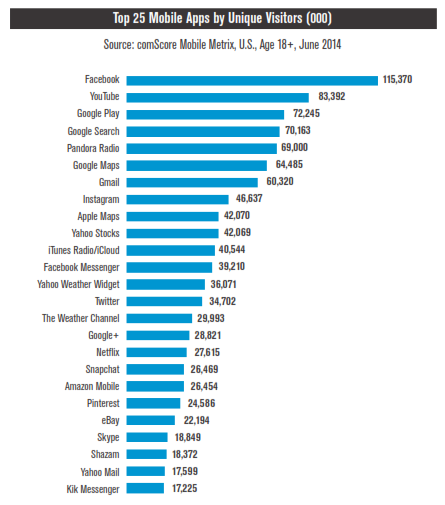
Figure 5
The comScore study also determined the top 25 most downloaded apps. Unsurprisingly, Facebook was the most downloaded app, having almost twice as many downloads as its direct competitor YouTube. It should be noted that Facebooks separate messaging app has more downloads than Twitter and Google+s own apps. Also notable are YouTubes, Netflixs, Pandoras, iTunes Radios, and Shazams download numbers being in the Top 25, harkening the earlier sentiment of devices being used mostly for entertainment. The correlation with operating devices shown in Figure 4 previously is also clear in Figure 5, as four of the top ten apps are from Google, and are found pre-installed in Android devices.
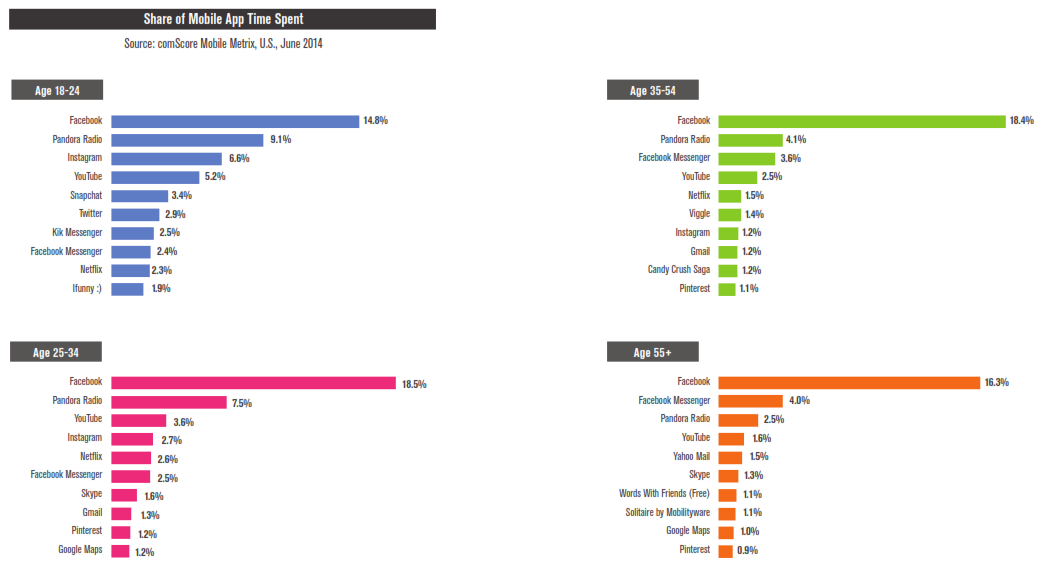
Figure 6
However, there were shifts in priority with apps when it came to different age groups. As seen in Figure 6, comScore looked at four different groups, and with the exception of the Facebook app, each of them had different ideas on what they considered to be important to them. For instance, young adults aged 18-24 favored more social media, messaging, and photo apps like Twitter, Instagram, and Snapchat.
On the other hand, slightly older adults favored more practical apps for their everyday use, like Google Maps, and used less messaging apps. Instead, slightly older adults focused on more polished messaging apps like Skype. Adults in their senior years were spending time with games that were not found in other age groups, particularly ones that could be played on their own like Solitare.
Conclusion: Weve Reached the App Majority
With all these numbers and trends, its no surprise that comScore is calling the time we spend on digital media today the app majority. We have now reached a tipping point where advertisers and marketers need to understand the full potential behind such a small program that can be installed on any device. It may still be an emerging market, but if the traditional advertising adage is right, dollars will follow eyeballs and right now, everyone is looking at their device screens.
Comments
comments